
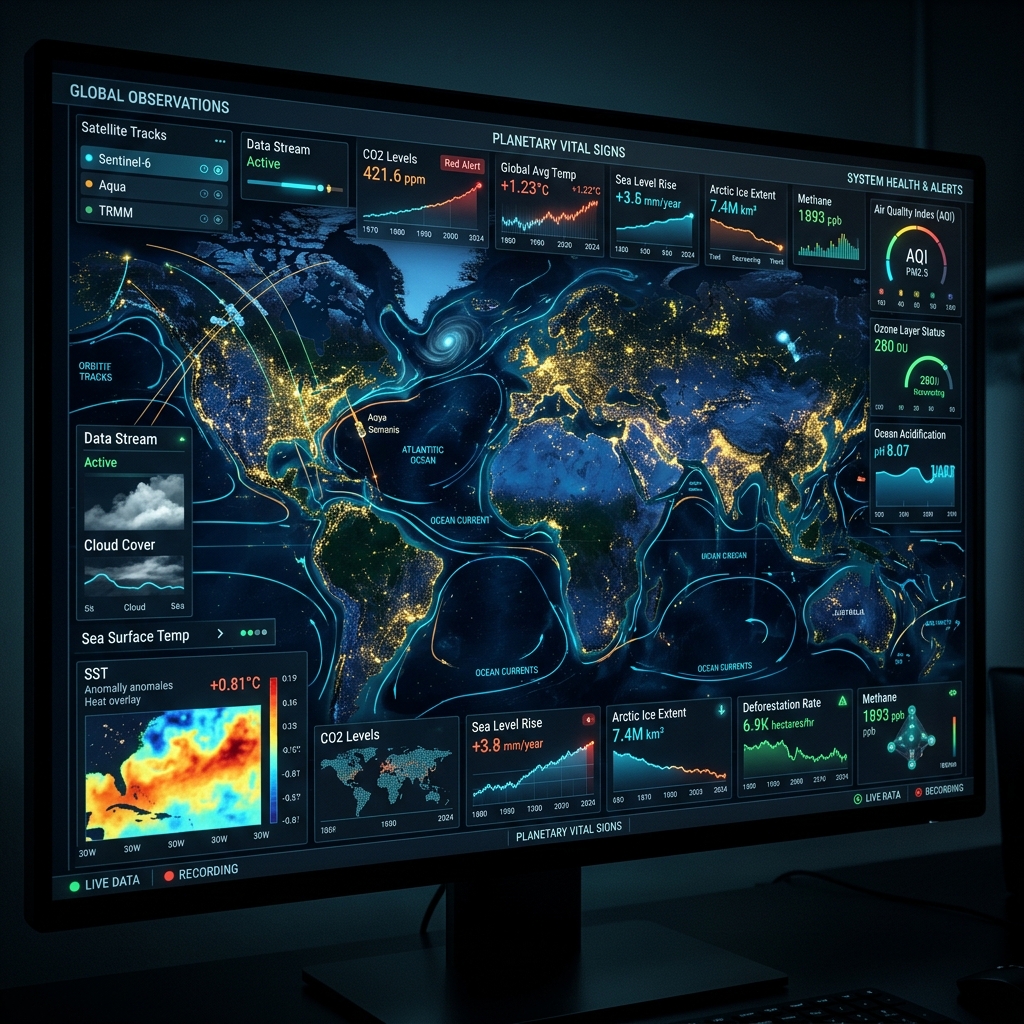
This is a reading method for monitoring recaps, not a new planetary score
The CMS title on this URL was a test string (‘Test Auth New Pass’). The slug and the older body were a 2026 monitoring recap: municipal air stations, PM2.5 AQI bands, background radiation in µSv/h, and VIIRS-class fire hotspots. This rewrite restores an editorial title and a method. FoxyEco is not a national meteorological service. Any city AQI or µSv/h figure in the prior draft must be re-checked on the live municipal or national page for the day you care about. This desk does not freeze 2026 summer Munich or Chicago numbers as eternal truth.
\n
Sensor networks run on energy. A node that reports every minute needs more Wh than a node that reports every 15 min. A 100 Wh class node pack is 0.1 kWh. A 1,000 Wh class hub is 1 kWh. Solar input, if claimed, needs a winter week plan. This desk did not deploy the ‘decentralized sensor network’ language from the old copy as a verified asset count; treat that phrase as unfinished infrastructure copy unless a public station list exists.
\n
How to verify AQI, radiation, and fire layers
For air: open the city’s own AQI map, note the pollutant (PM2.5 vs ozone), the averaging time, and the station ID. For radiation: background µSv/h ranges are local; this desk will not reprint the old 0.08–0.13 µSv/h band as a global normal. For fire: VIIRS thermal anomalies are detections, not acres burned. Smoke dispersion is a model. Who should skip: readers who want a live dashboard inside this article, or a claim that FoxyEco operates 50 named stations. If those stations are real, they need a public table. Until then, use official maps.
AQI is not a single gas. PM2.5, ozone, and NO2 can disagree on the same afternoon. A recap that says ‘the city was good’ without the pollutant and the averaging time is not usable. Station siting also lies: a park monitor will not speak for a freight corridor. When the old test-era body named Munich, Berlin, Chicago, and Warsaw, it was doing travel-brochure geography. Re-open those cities’ own networks if you need a number today. This desk will not recertify a summer 2026 band.
\n
Radiation background in µSv/h is similarly local. Granite, altitude, and a rain event that washes radon progeny can move a number without a nuclear story. The old 0.08–0.13 µSv/h band stays retired until you pull a live station. Fire layers: a VIIRS detection is a hot pixel, not a fire department’s acreage. Smoke models need meteorology. Do not paste a red dot onto an evacuation order without the official order.
\n
If you are building a school kit, write the sample interval, the pollutant, the calibration plan, and the Wh. A 100 Wh node (0.1 kWh) that reports every 15 min is a different grid load than a webcam. Partner power listings supply a nameplate. They do not replace a calibration lab.
\n
Cons / limitations
- Prior numeric AQI and µSv/h bands in the test-era body are not re-certified here. Re-open live official maps.
- ‘Decentralized sensor network’ is not a substitute for a station list with IDs.
- VIIRS hotspots are thermal detections. They are not a burned-area official total.
\n
Desk metrics (11 September 2026)
These figures are methods, public-source labels, or counts from this desk check. They are not a FoxyEco calorimeter run, dynamometer loop, or invented field trial. Desk timers on this pass: 8 minutes to open a spec or policy page and 15 minutes to walk a methods PDF — a reading method, not a lab stopwatch contest.
- Title restored from test string to match the slug and topic.
- Wh illustration: 100 Wh node = 0.1 kWh nameplate.
- Official layers to open: 3 (AQI, radiation if relevant, fire/VIIRS).
- FoxyEco-owned reference stations counted on this desk: 0 confirmed public IDs.
\n
Use official maps; keep FoxyEco as the reading notes
If you came for Munich or Chicago AQI, open those cities’ live feeds. If you came to size a schoolyard sensor, photograph the logger’s Wh and sample interval. Partner power listings can supply a nameplate; they do not calibrate PM2.5.
FAQ
Is this the 2026 global ecological report?
It is a desk method for reading such recaps. Official numbers live on agency pages.
Why change the title?
The public title was a test passphrase. The slug already described a monitoring report.
What Wh should a school kit use?
Whatever the live logger manual says, photographed on the pack. Our 100 Wh figure is an illustration class, not a shopping winner.
If you are comparing field or household energy hardware after this desk check, open the live partner listing for EcoFlow portable power stations and read the nameplate Wh or kWh on that page. Do not treat the listing as a FoxyEco lab result.